Hydrology & Floodplains
How water flows through the landscape: a brief overview of West Africa’s river basins, as driven by rainfall and artificial management.
Basins, tributaries and infrastructure
The large river systems in West Africa are fundamental to rural and urban communities: they provide water, food and energy, they act as main transport routes, and they are hotspots of biodiversity. The major river systems consist of the large catchments of the Senegal and Niger Rivers, along with the smaller catchments of the Sine Saloum, the Gambia, the Casamance and the Rio Geba Rivers (Fig. A). Further south, smaller river systems drain the coastal zone of Guinea Bissau, Guinea and Sierra Leone.
The Senegal Delta and Valley (both created by the Senegal River), as well as the Inner Niger Delta (created by the Niger River) belong to the eight major seasonal floodplains in sub-Saharan Africa (Fig. B). Farther to the east there are multiple floodplains around Lake Chad, including the Waza Logone, and in the South Sudan lies the Sudd, by far the largest floodplain in the Sahel. The Senegal Delta is largely constrained by embankments and no longer follows a seasonal flood pulse . Flooding in the Senegal Valley is partly managed artificially. The massive Inner Niger Delta remains a natural seasonal floodplain, although upstream interventions have reduced the river flow and consequently the maximum flood extent.
Below is an overview of the Niger and Senegal river basins, including existing and planned infrastructure, the hydrological regime, and insight into the functioning of the seasonal floodplains in these basins.
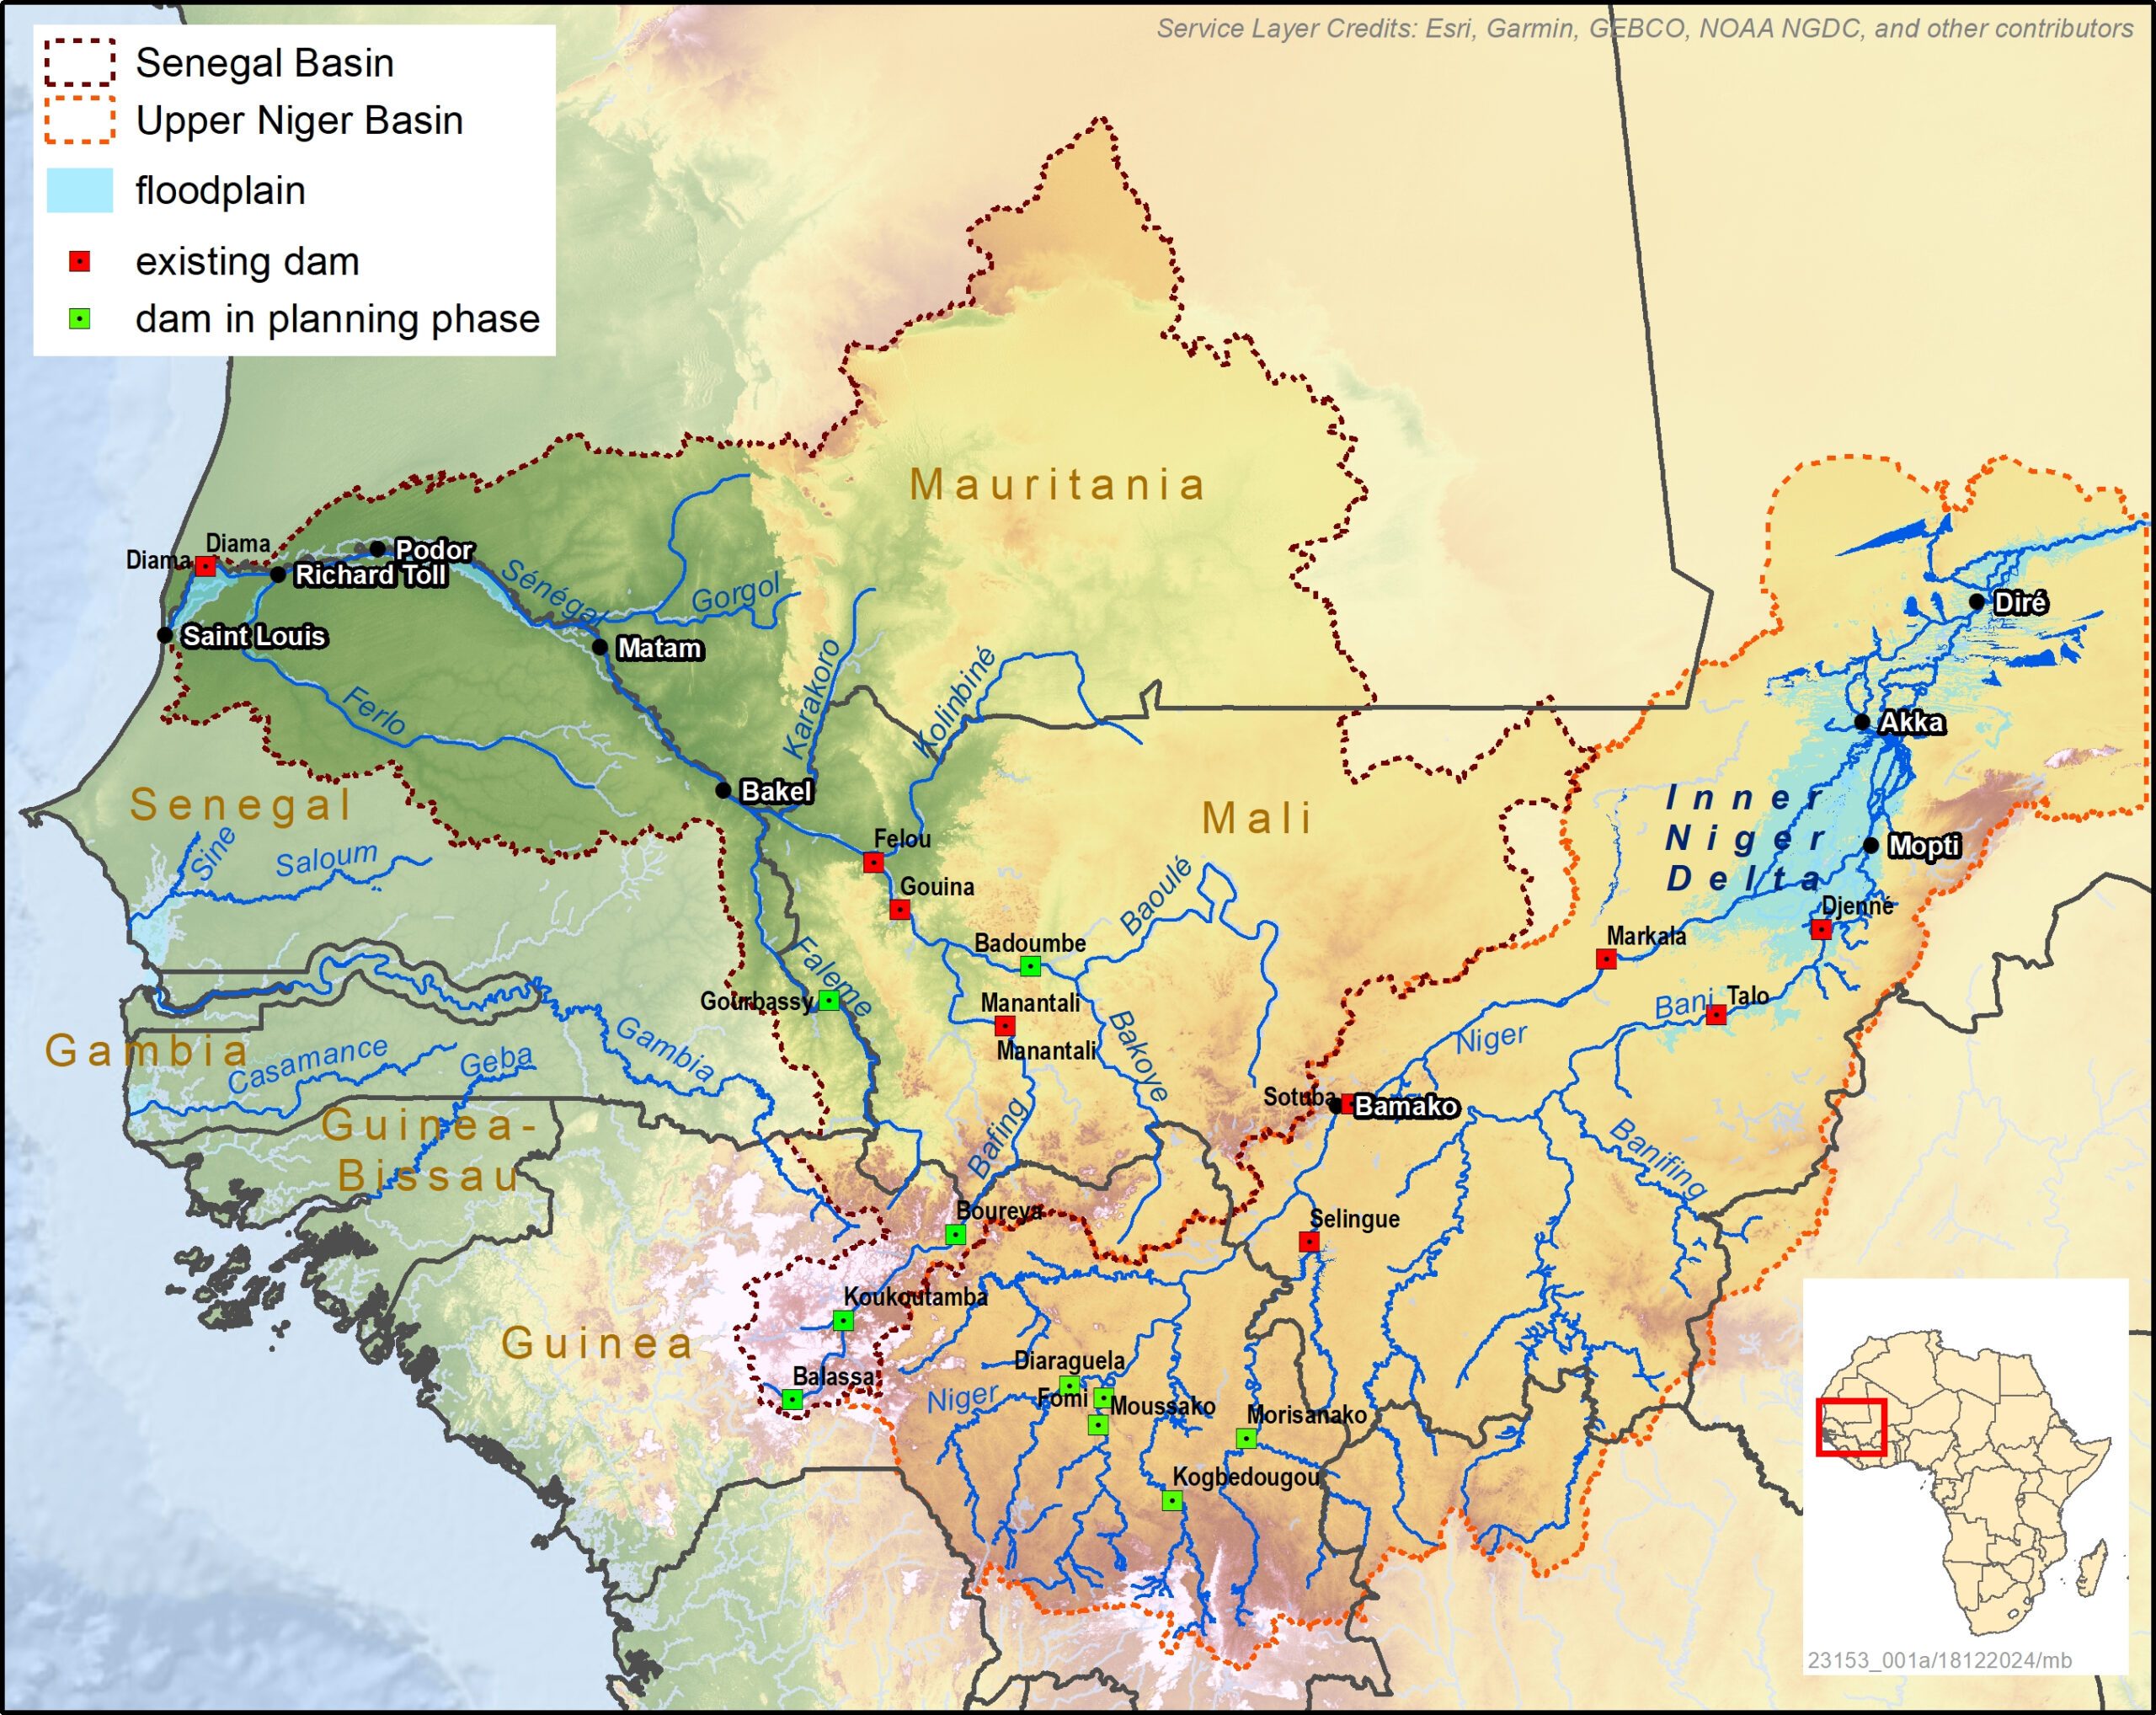
Figure A. River systems in West Africa. For the Senegal and the Upper Niger river basins, locations of existing dams and potential future dams are marked, and seasonal floodplains are shown in light blue.
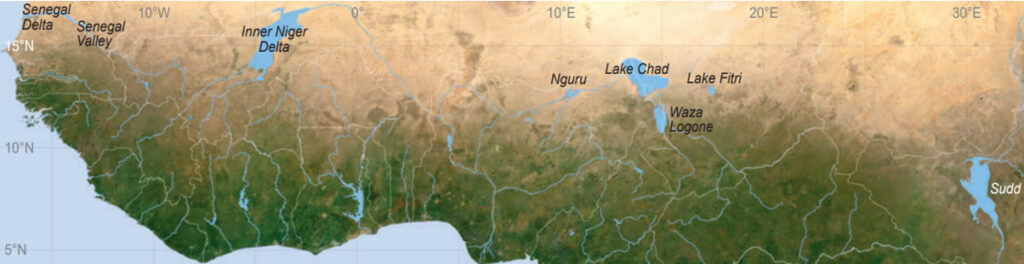
Figure. B. The eight most important floodplains in sub-Saharan Africa north of the Equator (source : Zwarts et al. 2023b).
Upper Niger Basin
At 4,180 km long, the Niger River is the longest river in West Africa and the third longest on the African continent. From its source in the highlands of Guinea, the river curves through the Sahel region via Mali and Niger, then flows through Nigeria and out into the Gulf of Guinea in the Atlantic Ocean. Along the way, the river drains a catchment area of over 2 million km2 and provides water to more than 100 million people. The Upper Niger Basin has three distinct sections: the upper basin of the Niger River upstream Markala, the upper basin of the Bani River upstream Djenné, and the lower region between Markala and Tombouctou, which forms the huge Inner Niger Delta.
The Niger and its tributaries rise in the Guinea Highlands. Next to the Niger proper there are five main tributaries: the Tinkisso, Niandan, Milo and Sankarani in Guinea and the Bani in Mali. The Tinkisso is the most northerly of these, originating in the Fouta Djallon region. The main tributary of the Niger in this region, however, is the Bani. It drains southern Mali and the northeastern corner of Côte d’Ivoire, and has a catchment area of 129,000 km2—nearly as large as the rest of the Upper Niger Basin combined (147,000 km2). Yet the discharge of the Bani at the entrance of the Inner Niger Delta is less than half that of the Niger River, because the Bani receives less rainfall than the other sub-basins of the Upper Niger. After the Bani flows into the Niger near Mopti, at the southern edge of the Inner Niger Delta, there is no further run-off from eastern Mali and Niger. Consequently, evaporation gradually diminishes the river flow.
Dams on the Upper Niger
The hydrological regime of the Niger River is no longer fully natural following the construction of the Markala dam in 1947 and Sélingué reservoir in 1982, along with several small weirs and irrigated agricultural fields.
The Sélingué reservoir is on the Sankarani River near the Guinean border. Built in 1982, the reservoir’s dam is used for hydropower and permits the irrigation of rice fields downstream. Keeping the Sélingué reservoir filled reduces the flow of the Niger by, on average, 61% in August and 36% in September; of the 1.8 km3 of water withheld annually, 0.5 km3 is lost due to evaporation. During the dry season (March to June), 0.2 km3 per month is released; this results in roughly double the amount of flow that would occur naturally during this period if the dam and reservoir were not present. The water stored annually in the reservoir amounts to 10–20% of the peak flow in wet years, and 20–30% in dry years.
Completed in 1947, the Markala dam was built to create the Office du Niger irrigation zone. The zone is located in the Delta Mort, an ancient delta of the Niger, and forms a secluded part of the Inner Niger Delta. As of 2020, this zone consists of 115,000 ha of rice and sugar cane cultures situated 40 km north-east of Ségou, on the north bank of the Niger. The Markala dam reduces the flow of the Niger River by 7% in a year with a high flow and 16% in a year with a low flow; the seasonal variation is even larger, with 60% of the Office du Niger’s consumption occurring in March compared to only a few per cent in October.
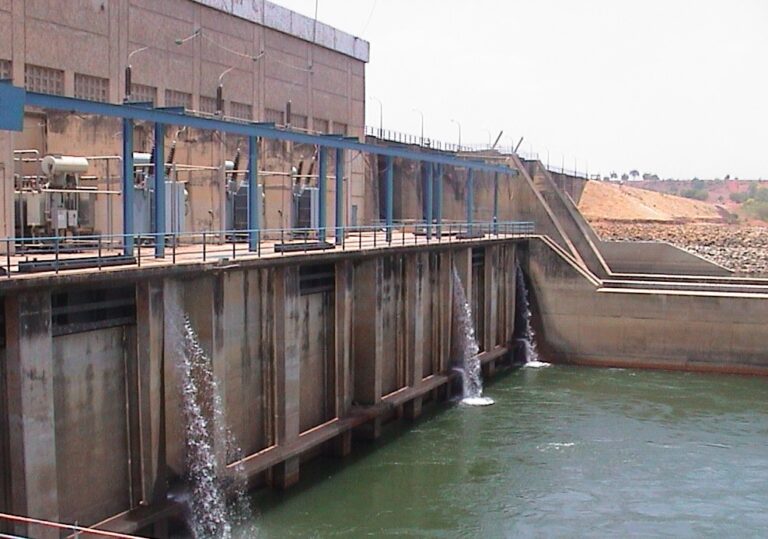
Sélingué dam, built in 1982, in the Sankarani River of the Upper Niger. Photograph E. Wymenga, April 2015
Other existing dams are Sotuba, a small hydropower plant on the Niger just downstream of Bamako, as well as two dams on the Bani River near Talo (2006) and Djenné. These two are relatively small dams, but they too reduce the peak flow of the Bani.
The future Fomi-Moussako dam is a major hydrological project planned for construction in the Niandan River, part of the upper catchment in Guinea. The reservoir will be used for hydropower in combination with irrigation and flood control. Feasibility studies have assessed multiple variants that differ in terms of reservoir dimension, energy production, water and land management strategy, and anticipated environmental and social impact (AECOM 2017, TRACTEBEL et al. 2017). The “Fomi” variant as assessed by Coyne & Bellier (2010) would yield a reservoir with a capacity of 6.16 km3, roughly three times as large as the Sélingué reservoir.
In the same region of the Upper Niger Basin in Guinea, there are assessments being made for three much smaller dams (near Diaraguela, Morisanako and Kogbedougou) with the main purpose of producing energy.
Senegal Basin
The Senegal River is the second largest river in West Africa; it is 1,800 km long and drains a catchment of about 340,300 km2. From its source in the highlands of Guinea, the Senegal River flows through Mali and between Mauritania and Senegal, acting as the border between the two countries. The Senegal Basin has three distinct sections: the upper basin upstream of Bakel, the middle valley between Bakel and Podor, and the lower region between Podor and Saint-Louis, which forms the huge estuarine Senegal Delta. Along its course, the Senegal River is essential for the drinking water supply of the major cities of Dakar and Nouakchott, and it forms the foundation of important sectors such as agriculture, animal husbandry, fishing and energy production.
The Senegal River has three main tributaries, the Bafing, Bakoye and Falémé Rivers. All three rise in the Fouta Djallon mountains of Guinea, where annual rainfall exceeds 2,000 mm. The Bafing River is responsible for nearly half the total flow of the Senegal. The Bakoye River is the next most important tributary; it originates about 250 km to the east on the Manding Plateau in western Mali, and contributes nearly a quarter of the Senegal’s flow. Most of the remaining water comes from the Falémé River; the other tributaries, which rise in Mauritania and Mali, receive very limited rainfall and thus hardly contribute to the Senegal’s main flow.
Dams on the Senegal
Periods of severe drought in the 1970s and 1980s (called the Great Drought, or La Grande Sécheresse) underscored the need for active water management within the basin. Within this framework in 1972, the OMVS (l’Organisation pour la Mise en Valeur du fleuve Sénégal) was created, operating throughout the basin. To counter the drought-driven food crises that struck the Sahel in the 1970s and 1980s, the OMVS aimed to implement more irrigation that would further facilitate rice cultivation. This led to the construction of the Diama dam in the lower delta and the Manantali reservoir in the upper basin.
The resulting two dams—the Diama dam in northern Senegal (completed in 1986) and the Manantali dam in western Mali (completed in 1988)—have dramatically changed the hydrological dynamics of the Senegal River. The realisation of the Diama dam and reservoir was also an important milestone in the embankment and cultivation of the Senegal Delta.
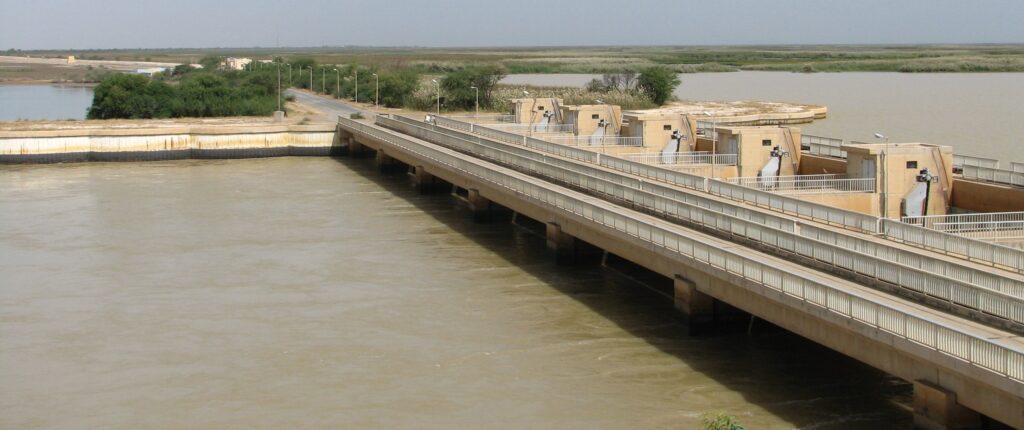
Diama dam, completed in 1986, in the Senegal River. Photograph E. Wymenga, December 2005.
Before the construction of these dams, water levels followed the flood pulse generated by rainfall in the catchment area. An estimated average area of 459,000 ha was flooded every year on both sides of the river, with massive variation in size, height and duration of floods. Depending on the flood, between 15,000 and 150,000 ha could be used for flood recession crops. Since the construction of the Diama (far downstream, close to the Senegal River’s outlet) and the Manantali dam (far upstream, near its source), water levels in the middle valley have been more stable throughout the year. The current management approach guarantees a regulated articifical flood pulse, created by releasing water at Manantali dam.
Both dams were constructed primarily to facilitate irrigation during the dry season. The Diama dam—which was instrumental to the embankment and cultivation of the Senegal Delta—also prevents the intrusion of salt water from the delta into areas upstream. Meanwhile, the Manantali dam provides hydroelectric power. With a storage volume of 12 km3 and a capacity of 800 GwH per year, the Manantali dam supplies energy to three of the member states of the OMVS (Senegal, Mali and Mauritania).
The Gouina dam in the Bafing tributary has recently been completed. More dams are planned in the upper basin, mainly to generate energy and facilitate local irrigation.
Rainfall and discharge
Rainfall in the headwaters of river systems in West Africa determines the initial river flow. Due to seasonal and annual variations in rainfall, river flows and therefore flood levels vary greatly. Most river systems in West Africa still have a more or less natural character. However, dams and water intake upstream, including for large-scale irrigation such as at Office du Niger in Mali, increasingly have major impacts on downstream flow and associated flooding.
River flow is affected differently by dams compared to upstream water intake for irrigation (Fig. C). With dams, water is withheld during the wet season to fill a reservoir and released in the dry season to generate electricity or to supply water for irrigation. Meanwhile, water is lost due to evaporation. With irrigation, there is a continuous intake of water from the river. In both cases, the impact of river flow is relatively small during a high flood and large during a low flood.
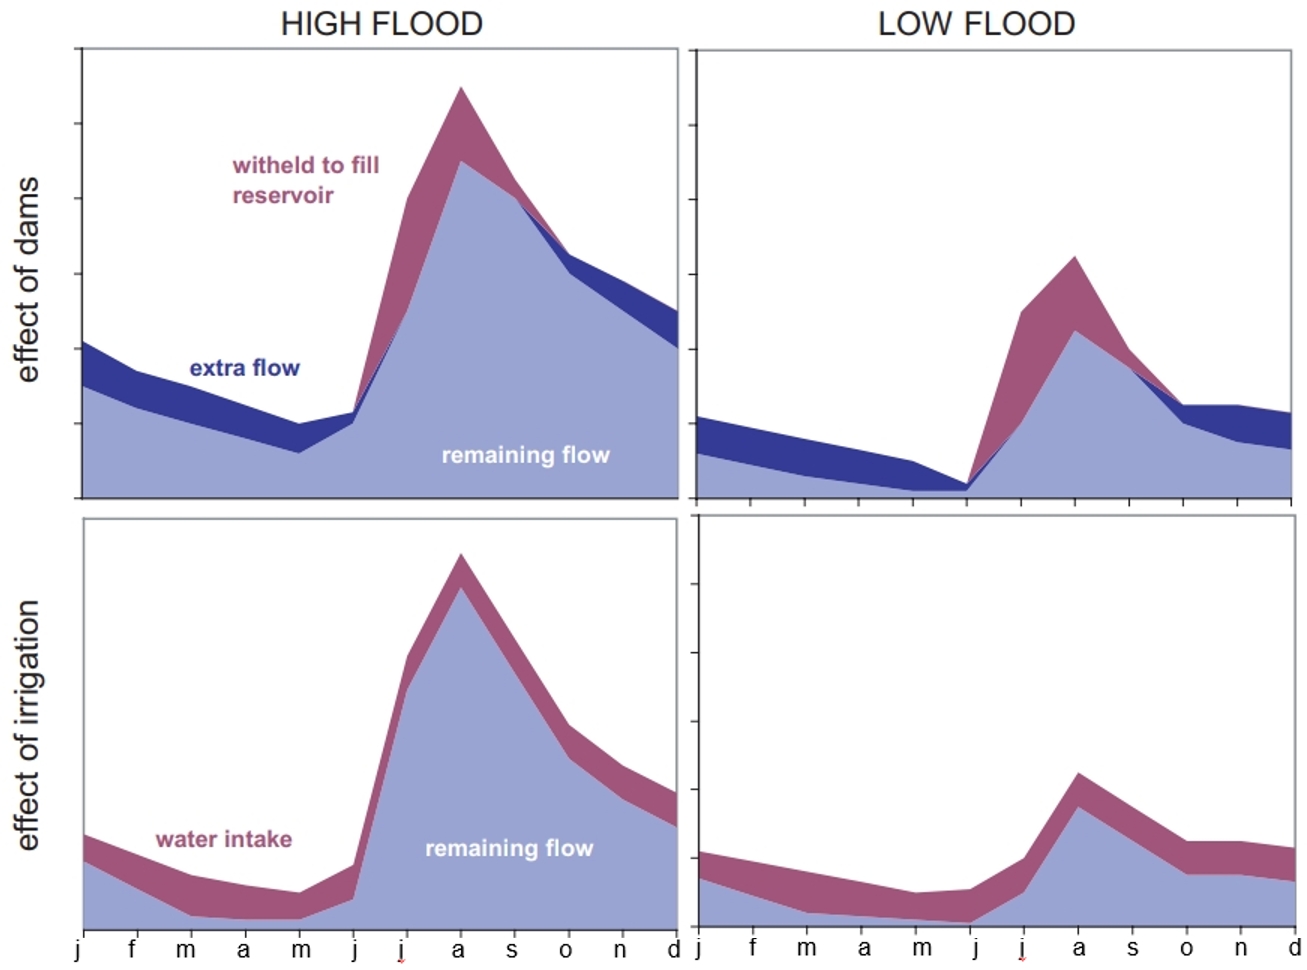
Figure C. Hydrological effects of dams and irrigation in the Sahel during the flood cycle in years with high versus low flood levels. The flood cycle runs from June to December, while lowest flow levels occur from March to May. Figure from Zwarts et al. (2005).
Long-term rainfall data and discharge monitoring enable researchers to show how river flow is related to rainfall. For example, annual rainfall in the Bani catchment area usually varies from 1000 mm to 1200 mm, and wet and dry periods are reflected in flow: The Bani’s flow (measured in September) dropped from 3000 m3/s to only 250 m3/s during the Great Drought in the early 1980s, but subsequently gradually increased again. A similar pattern occurred in the Upper Niger River; since 1922 the average annual rainfall in the Upper Niger Basin has varied between 1300 and 1600 mm, and during the Great Drought of the 1970s and 1980s the Niger decreased in flow by nearly 50% (Fig. D).
High inflow of the Bani and Niger Rivers not only produces a high flood level, but it also floods a more extensive area in the Inner Niger Delta. In the dry year of 1984, for example, only one third of the delta was inundated; the northern part of the delta was not touched at all by the flood. In the wet year of 1999, in contrast, the southern delta was fully flooded, as was a large part of the northern delta and several of the lakes just north of the delta. In the Senegal River the same patterns occur, with high discharge and extensive flooding in wet years and the opposite in dry years (though as discussed above, the Senegal River system is also heavily influenced by hydrological infrastructure).
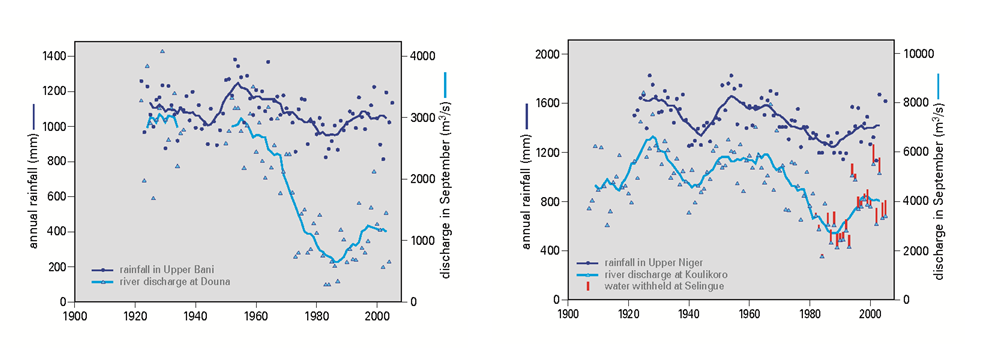
Fig. D. Left: Annual rainfall in the Upper Bani sub-basin (based on 28 rainfall stations, left y-axis) and river discharge measured in September at Douna (right y-axis). Trendlines show the 9-year running mean.
Right: Annual rainfall in the Upper Niger sub-basin (17 rainfall stations) and river discharge measured in September at Koulikoro. Trendlines show the 9-year running mean and red bars show the effect of the Sélingué reservoir. Figure from Zwarts et al. (2009).
Flood dynamics: Inner Niger Delta
The flood moves like a long, slow wave through the delta, which means that in a given year not all floodplains of the delta are flooded at the same time. Water levels measured at the stations in Mopti, for example, provide snapshots of this seasonal pulse. Mopti is located on the southern edge of the Inner Niger Delta, where the Niger and Bani Rivers converge. The amount of water in Mopti is at its lowest in April–June, and the flood pulse passes through during July–February, usually reaching maximum flood levels in October or early November at the latest. At that time, water levels to the north are still increasing; flooding in Akka, in the central part of the delta, usually peaks in late November or early December, while in Dire, in the northern part of the delta, flooding peaks a week later. By then, the southern floodplains near Mopti have already run dry (Fig. E).
The seasonal flood pulse is illustrated by the water levels at the stations in Mopti. Mopti is located on the southern edge of the delta, where the Niger and Bani rivers converge. The flood pulse passes Mopti from July to February: Water levels in Mopti are at their lowest from April – June (étiage), and start to rise in July. Maximum flood levels are reached in late October or in November, depending on the height of the flood.
The flood moves as a wave through the delta, which means that in the same year not all floodplains of the delta are flooded at the same time. Flooding starts in the south in August and in most years the peak in Mopti is reached in the first half of October. Water levels in the centre and north of the delta are still rising at that time. In the centre of the delta (Akka) the flood peak and maximal flooding in most years is reached in the second half of November of early December, and in Dire about a week later. The southern floodplains already run dry at the time (Fig. E).
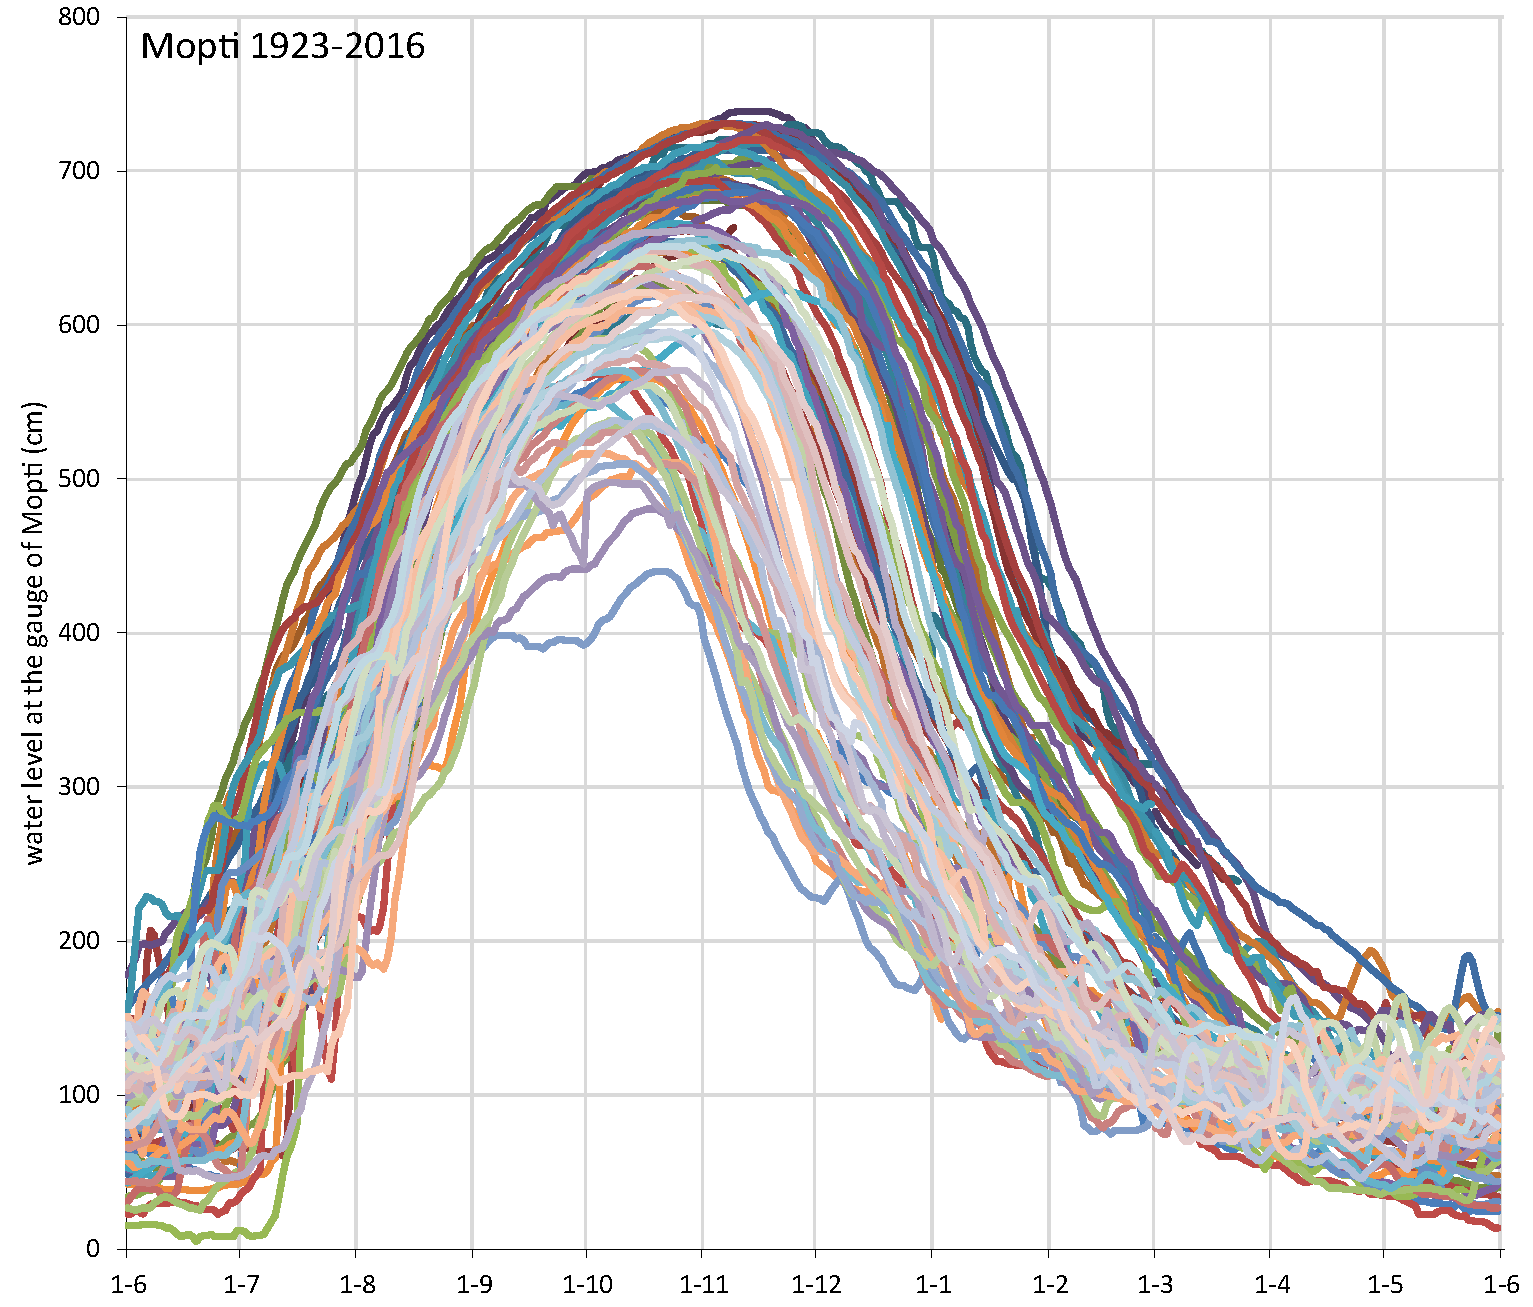
Fig. E. Daily variation in water level (cm) in Mopti from 1923 to 2016, measured between 1 June and 1 June the next year. Each coloured line represents an annual flood cycle. In dry years, flooding peaks in early October; in wet years, the peak is more than a month later. Data DNH, Mali. Figure from Zwarts et al. 2009, updated with unpublished data (www.opidin.org).
The floodplains of the Inner Niger Delta have a total surface area of 31,130 km2, including a section of 3,840 km2 that is permanently covered by water (Zwarts et al. 2005, 2009). Different levels of flow in the Bani and Niger between years mean there is considerable variation in how much of the total floodplain area is actually inundated in a given year. For example, in 1984, with a maximal flood level of 336 cm at Akka, satellite imagery showed that only 7,800 km2 was flooded; in 1999, in contrast, water levels at Akka reached 511 cm and an area of 18,000 km2 was flooded (Fig. F). The spatial pattern of flooding also varies widely between dry and wet years.
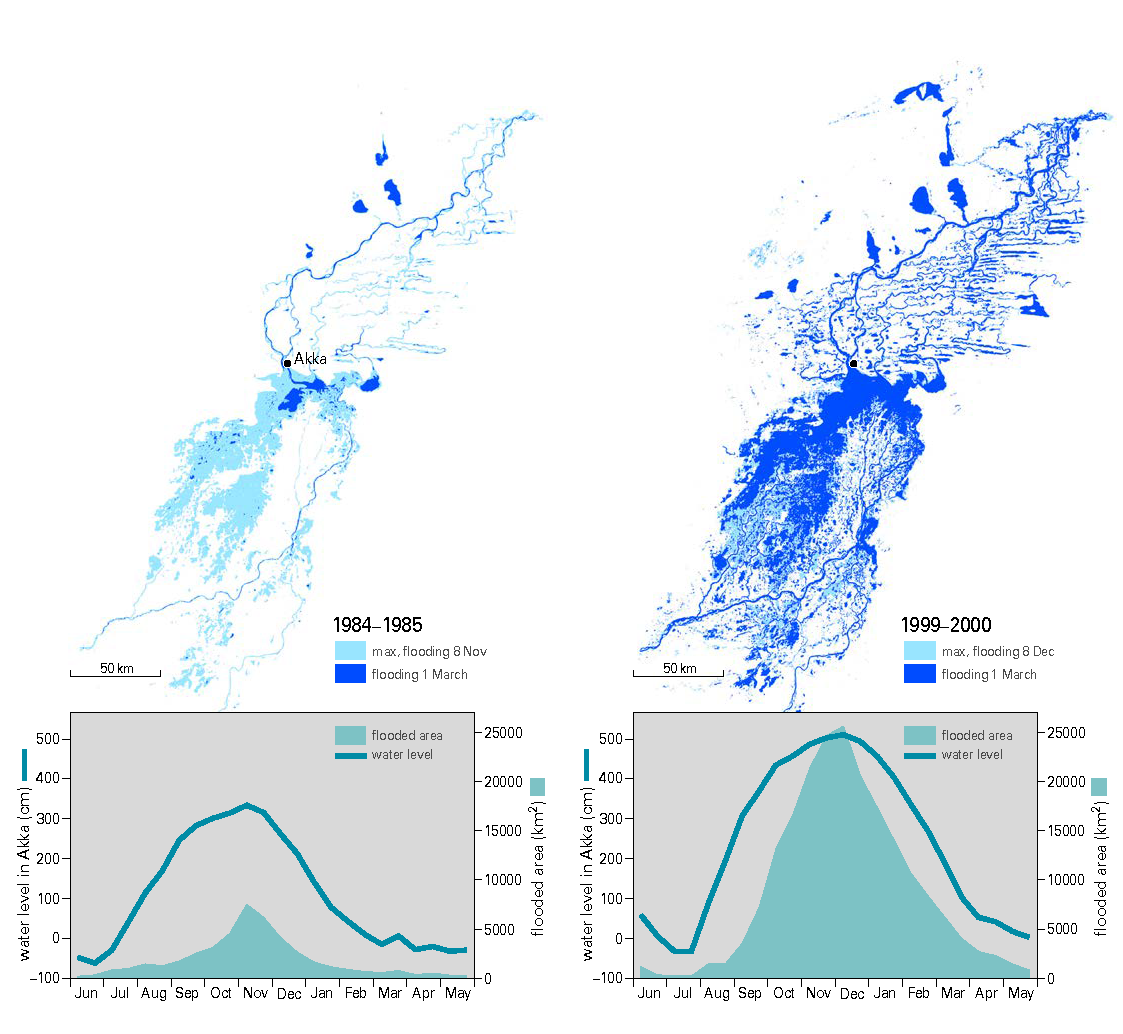
Fig. F. Daily measurements of the water level at Akka (left axis in both graphs) between June and May in 1984–1985 (left graph; the lowest flood level on record) and 1999–2000 (right graph; one of the highest floods since 1970). The maps show the flooded area when the water level at Akka reached its peak (aqua) and on 1 March (blue). Note that peak flood level in 1999–2000 (511 cm) was 1.5 times higher than in 1984–1985 (336 cm), but maximal flood extent was nearly 4 times larger. The surface area that remained flooded on 1 March, several months after the peak, was 13 times larger in 1999–2000 compared to 1984–1985. Figure from Zwarts et al. (2009).
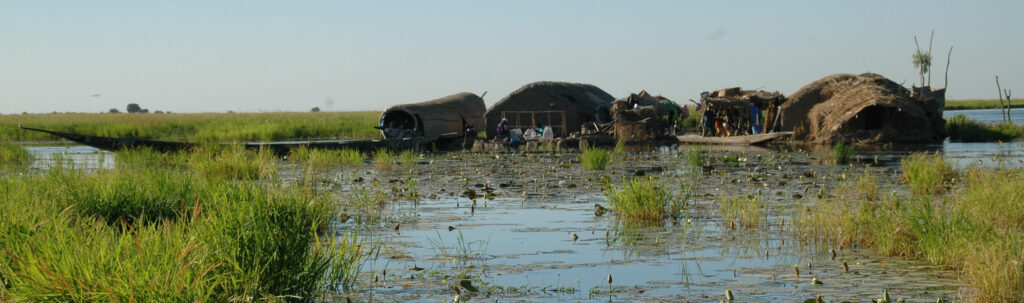
Temporary fishers’ camp during a high flood in the Inner Niger Delta, Mali. Photograph L. Zwarts, November 2008.
Flood dynamics: Senegal Valley and Delta
Despite the embankments, dams, and irrigation systems that have significantly altered the flood dynamics of the Senegal River Basin, rainfall in the upper reaches of the basin is still the main driver behind the major fluctuations in water level and flow rate of the Senegal River (Bader & Abergel 2015, Mietton et al. 2007, Zwarts et al. 2009). In July, water levels start to rise in the middle valley and the Senegal Delta. They rapidly reach a peak in September, dropping again to reach dry season levels in January. Every year, vast areas of the seasonal floodplains in the middle valley are flooded. In the past this was also the case in the Senegal Delta, but this changed after major embankments were created in the delta in the 1960s and 1990s and the Diama dam and Manantali reservoir were constructed at either end of the river basin. Today, the delta has lost almost 97% of its seasonal floodplains—only in Djoudj National Park and Diawling National Park is an artificial flood regime maintained through active water management.
Senegal Valley
Before the construction of the dams, water levels across the Senegal Valley were determined by a flood pulse generated by precipitation in the catchment area. However, the Great Drought of the 1970s and 1980s established a need for active water management within the basin. Since the construction of the dams, water levels in the river are more stable throughout the year, and releases at Manantali dam prevent the region from experiencing severely reduced water levels during the dry season. For example, at Podor before the dams were constructed, water levels remained below 70 cm during the dry season and increased fivefold to roughly 350 cm in the wet season. Since the 1990s, in contrast, water levels at Podor have been maintained at around 250 cm during the dry season, increasing to 400 cm in the wet season (Fig. G).
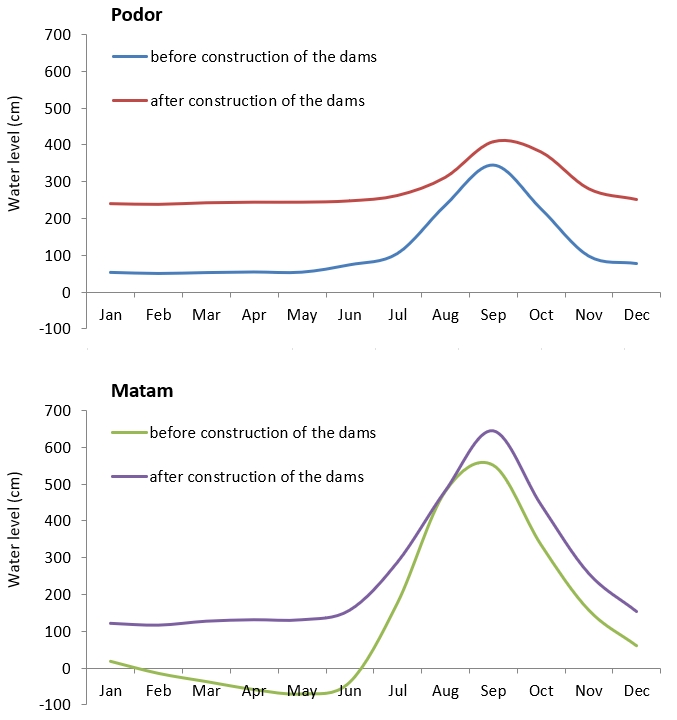
Figure G. Mean maximum water levels (cm) in the Senegal River at two hydrological stations, Podor and Matam, before (1980–1983) and after (1990–2017) the construction of the Diama and Manantali dams. The negative values for water levels recorded at Matam in 1980–1983 refer to the period with lowest water levels. Figure from Mettrop et al. (2019); data provided by the OMVS.
The difference before and after construction of the dams is even larger at Matam than at Podor. Under the natural flooding regime prior to dam construction, the low water levels of the dry season at Podor were partially offset by an inflow of river water from the adjacent Senegal Delta. But this water did not reach upstream as far as Matam and the rest of the middle valley, which means that these parts of the basin dried out in the dry season—with extremely little water present during dry years, such as during the Great Drought. Since the 1990s, however, water levels at Matam are maintained at above 100 cm in the dry season (through releases at the Manantali dam) and up to more than 600 cm during the peak of the flood season (Fig. G).
Water dynamics in the Senegal Valley are determined by discharge of the Senegal River, which in turn is controlled by upstream rainfall and dam management. River discharge is highly correlated with water levels and flood area between Matam and Podor (Metttrop et al. 2019). Since water levels are measured daily by the OMVS, this data can be used as a proxy for river discharge. The extent of inundation is highly correlated with water level in the Senegal Valley (Fig. H).
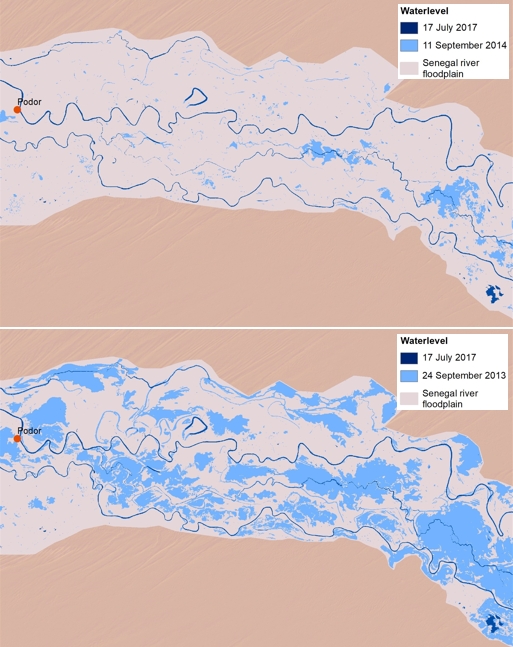
Figure H. Visual of water patterns in the Senegal Valley upstream of Podor, based on observations made in multiple years. Dark blue shows water present during the dry season (both panels). Light blue denotes flood extent during moderate flooding (upper panel) and more substantial flooding (lower panel). Figure from Mettrop et al. (2019); data provided by the OMVS.
Senegal Delta
Further downstream, the hydrological system of the Senegal Delta has also been fundamentally changed by the presence of embankments and dams; the delta has lost its original estuarine floodplain character. Early plans to cultivate the river delta and capitalise on its natural assets—as envisioned by the colonial French administration in the mid-1800s—focused on improving the navigability of the river and creating opportunities for cotton cultivation. These efforts were impeded by various economic and climatic barriers; it was not until the second half of the 1900s that significant interventions took place, resulting in the first rice fields near the town of Richard Toll and embankments along the southern side of the river in Senegal. By halfway through the 1970s, about 10,000 ha had been irrigated for rice cultivation.
The cultivation of the Senegal Delta gained momentum with the construction of the Diama dam and the Manantali reservoir in the 1980s. The infrastructure at Diama initially caused flooding of the delta to cease across a large part of the Mauritanian side of the river, leading to a desert-like environment and hypersaline conditions in the remaining water bodies. To counter negative environmental impacts, artificial flooding was maintained in Senegal’s Djoudj National Park, and in 1994 controlled flooding was also restored in the Diawling basins on the Mauritanian side to the north. (Fig. I).
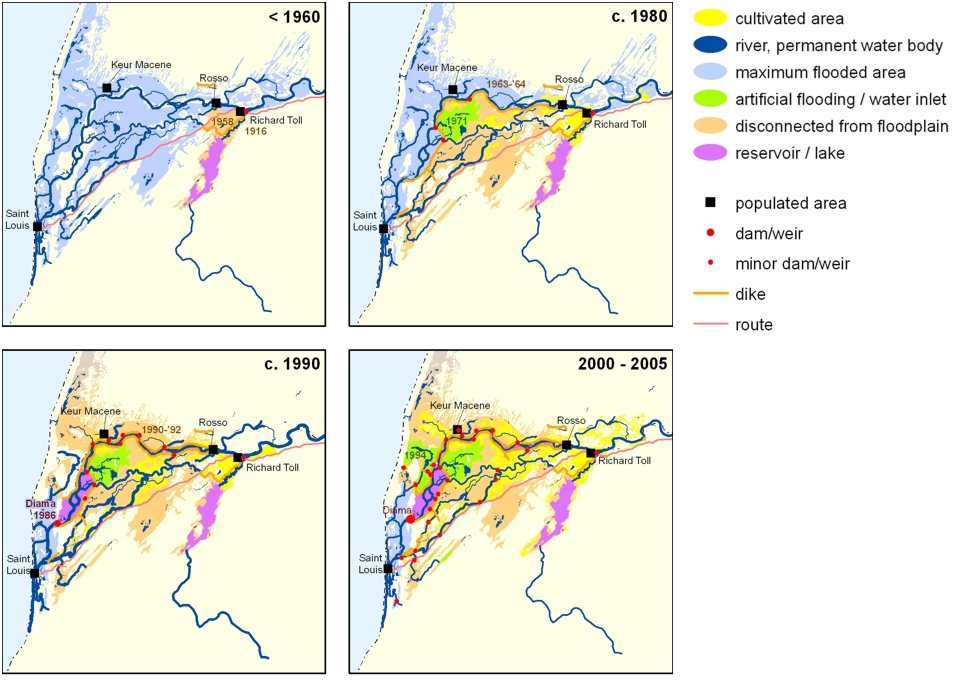
Figure I. Historical overview of the hydrological development of the Senegal Delta, including locations and approximate years of completion for dikes and dams. Figure from Zwarts et al. (2009).
Sources and more information
AECOM 2017. Actualisation de l’étude d’impact environnemental et social du barrage à buts multiples de Fomi en Guinée. Phase 1. Scoping pour déterminer la configuration du barrage de Fomi. Ministère de l’Agriculture, Direction Nationale du Génie Rural. Rapport provisoire de la Phase 1 – Novembre 2017. AECOM.
Aich, V, Liersch S, Vetter, T, Fournet S, Andersson JCM, Calmanti S, van Weert FHA Hattermann FF & Paton 2016. Flood projections within the Niger River Basin under future land use and climate change. Science of The Total Environment 562: 666-677, ISSN 0048-9697,
Bader, J.C., Albergel, J., 2015. Artificial flood support on the Senegal river: a challenge to protect natural resources in the valley. Montpellier: L’Institut de Rescherche pour le Developpement (IRD).
Bonneval, P, Kuper M & Tonneau J-P. 2002. L’Office du Niger, grenier à riz du Mali: Succès économiques, tran – sitions culturelles et politiques de développement; Le fil de l’eau et la part des homes. La Librairie de Cirad. Montpellier Cedex.
BRLi & BETICO 2015-2016. Projet d’accroisement de la productivité agricole au Mali (PAPAM). Étude du Programme d’Aménagement Hydro-Agricole (PAHA) de la zone Office du Niger (ON). Rapports de Phase 1-3. BRLi/BETICO.
BRLi & DHI. 2007. Establishment of a water management model for the Niger River Basin. Final Report.
Brunet-Moret, Y., Chaperon P., Lamagat JP. & Molinier M. 1986. Monographie hydrologique du Fleuve Niger. Tome 1. Niger supérieur. Editions de l’ORSTOM ; Monographies Hydrologiques 8. 2605 pp. Download link.
Coyne et Bellier 2010. Étude d’impact environnemental et social du projet de barrage de Fomi, Autorité du Bassin du Niger – Ministère de l’Énergie et de l’Hydraulique : Plan de gestion environnementale et sociale, Plan de développement local, Résumé de l’Étude d’Impact Environnemental et Social. Coyne et Bellier.
DeGeorges, A., Reilly, B.K., 2006. Dams and large scale irrigation on the Senegal River: impacts on man and the environment. International Journal of Environmental Studies 63 (5): 633-644. Download link.
Hassane, A., Kuper M. & Orange D. 2000. Influence des aménagements hydrauliques et hydro-agricoles du Niger Supérieure sur l’onde de la crue du delta intérieur du Niger au Mali. Sud Sciences et technologies 5 : 16-31.
Liersch, S, Fournet S & Koch H. 2017. Assessment of Climate Change and Water Management Impacts on the Water Resources in the Upper Niger and Bani River basins. Potsdam Institute for Climate Impact Research, Potsdam. Draft, 9 June 2017.
Mettrop, I.S., Wymenga E., Klop E. & Bekkema M. 2019. Impacts du changement climatique dans le bassin du fleuve Sénégal: une évaluation spatiale de la vulnérabilité. A&W-rapport 2253, Altenburg & Wymenga, Feanwâlden. Download link.
Mietton, M., Dumas, D., Hamerlynck, O., Kane, A., Coly, A., Duvail, S., Pesneaud, F., Baba, M.L.O., 2007. Water management in the Senegal River Delta : a continuing uncertainty. Hydrology and Earth System Sciences Discussions 4: 4297-4323.
OMVS 2011. SDAGE du Fleuve Sénégal, Phase III: version définitive. Organisation pour la Mise en Valeur du Fleuve Sénégal.
Orange, D, Arfi R, Kuper M, Morand P, Poncet Y, editors 2002. Gestion intégrée des ressources naturelles en zones inonables tropicales. Paris: IRD.
TRACTEBEL ENGINEERING s.a. 2017. FOMI dam project on the Upper Niger: update of the feasibility study, detailed design (APD) – Phase I. Hydrological report – Hydrological study. P.010186 RP 2-001-E-Vol. 1a & 1b. TRACTEBEL, Cedex.
Zwarts, L, van Beukering P, Kone B & Wymenga E. 2005. The Niger, a lifeline. Rijkswaterstaat / IVM / Wetlands International / A&W. p .1-304. Download link.
Zwarts, L., Bijlsma R.G. & van der Kamp J. 2023b. The fortunes of migratory birds from Eurasia: being on a tightrope in the Sahel. Ardea 111: 397–437. Supplementary material. doi:10.5253/arde.2022.a29. Download link.
Zwarts, L., Bijlsma, R., van der Kamp, J. & Wymenga, E. 2009. Living on the Edge: Wetlands and bird in a changing Sahel. KNNV Publishing. 564 p. Download link.
Zwarts, L., Bijlsma, R., van der Kamp, J. & Wymenga, E. 2009. Les Ailes du Sahel: Zones humides et oiseaux migrateurs dans un environnement en mutation. KNNV Publishing. 564 p. Download link.
More information Inner Niger Delta
Zwart, L. 2010. Will the Inner Niger Delta shrivel up due to climate change and water use upstream? A&W rapport 1537. Altenburg & Wymenga ecologisch onderzoek, Feanwâlden. Download link.
Zwarts, L. 2012. The impact of a lower river flow on the inundation, vegetation and land use in the Inner Niger Delta. A&W-rapport 1868. Altenburg & Wymenga ecologisch onderzoek, Feanwâlden. Download link.
Zwarts. L. & J.L. Frerotte 2012. Water crisis in the Inner Niger Delta (Mali), Causes, consequences, solutions. A&W-report 1832. Altenburg & Wymenga ecologisch onderzoek, Feanwâlden. Download link.
Zwarts, L. & F. Hoekema 2013. Atlas: Les plaines inondables du Delta Intérieur du Niger. A&W-rapport 1908. Altenburg & Wymenga conceillers écologique, Feanwâlden, Pays-Bas. Download link.
Zwarts, L. 2013. OPIDIN : Prédiction des inondations dans le Delta Intérieur du Niger. A&W-rapport 1933. Altenburg & Wymenga consultants écologistes, Feanwâlden, Pays-Bas. Download link.
Zwarts, L. & J. van der Kamp 2013. Does the Inner Niger Delta suffer from a reduced river flow in the dry season? A&W-rapport 1938. Altenburg & Wymenga ecologisch onderzoek, Feanwâlden. Download link.
Bekkema, M. & L. Zwarts 2019. Using Sentinel-2 satellite data for detection of trees in the Inner Niger Delta. A&W-report 2555. Altenburg & Wymenga ecologisch onderzoek b.v., Feanwâlden. Download link.