Weather & Climate
Rainfall and drought: an overview of the Sahel’s weather and climate
It takes only one long day of travel to go from the edge of the Sahara Desert in Mauritania to the wooded savannas and humid forests of Guinea, but in that distance the annual average rainfall increases twentyfold—from no more than 100 mm at 17ºN, to roughly 2000 mm at 10ºN. This rainfall gradient is marked by drastic changes in the landscape, including land cover and vegetation, while the weather is characterised by distinct seasonality and a huge variation in annual rainfall. For the people living in this zone, periods of severe drought in the 1970s and 1980s remain part of the collective memory.
Weather and climate in Africa have long been tracked and forecasted by national meteorological institutes. Along with daily monitoring by weather stations, satellite imagery has become an important tool. This page provides information on the general rainfall patterns of Africa, including seasonal and annual variation, and ends with a short overview of the current knowledge on climate change in the Sahel.
General pattern of rainfall
Weather patterns in Africa are driven by the Intertropical Convergence Zone (ITCZ), a belt of low pressure that hugs the equator. On a continental scale, this leads to a characteristic rainfall pattern with very humid conditions around the equator and diminishing levels of rainfall to the north and south—a dramatic gradient that occurs over a remarkably short distance. Air circulation around the equator is the main driver of annual rainfall patterns: ascending warm, moist air to the immediate north and south of the equator is sucked into the ITCZ and, at altitudes of 10–15 km, is transported farther to the north and south. To compensate for the rising air in the convergence zone, a northern flow descends in the desert zone (normally centred between 20° and 30°N). The descending air heats up as pressure increases, becoming undersaturated with water vapour and leading to the classic clear skies and general aridity of the Sahara.
This air circulation system is called the Hadley cell, and it causes the prevailing wind over the Sahara—the harmattan—to blow from the northeast. The harmattan is a well-known phenomenon in West Africa, and brings dry, dusty air to the Sahel and further south. During the northern summer, when the sun is overhead in the Sahara, a low-pressure belt forms over the Sahel—bringing clouds, rain, frequent thunderstorms, and a monsoon from the southeast.
Using annual rainfall as a long-term determinant of potential vegetation, the landscapes and ecosystems along the rainfall gradient between the Sahara and the rainforests in the south are often classified into the following bio-climate zones: Sahel zone (200–500 mm), Sudan zone (500–900 mm, dry savanna) and Guinea zone (900–1800 mm, moist savanna). The delineations between these climate zones shift depending on rainfall patterns between years and changes to the landscape caused by intensified land use.
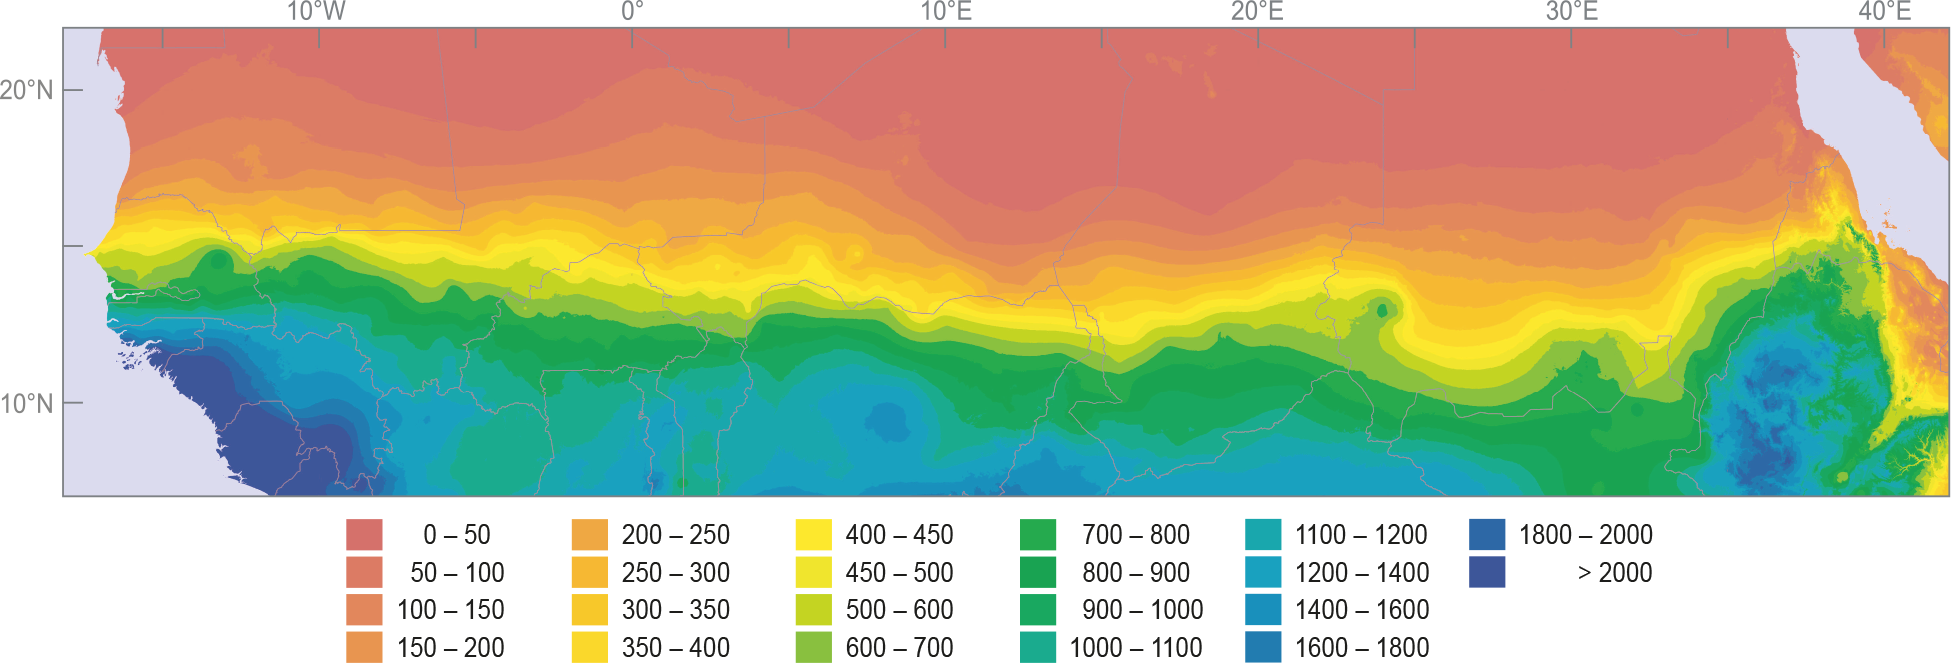
Rainfall contour lines showing average annual rainfall based on rain gauge measurements from the period 1950-2000 across the Sahel (Zwarts et al. 2023a, derived from Hijmans et al. 2005).
Seasonal variation
The weather in the Sahel has distinct seasonal differences; in general, there is a hot, dry season from November to April, and a humid, rainy season from May to October. This pattern is the result of a seasonal shift of the ITCZ to the north and south of the equator. The ITCZ moves between the tropic of Cancer in the north (21 June) and the tropic of Capricorn in the south (21 December), according to the position of the sun.
Seasonal weather patterns vary accordingly from north to south. In the Sudan zone and in the mountainous upper reaches of the Niger River and Senegal River in Guinea (roughly 4–8ºN), the rainy season extends from March to October. In the north (16–18ºN), for example in the Tombouctou region in Mali, any rain that falls does so in the period from June to September. In every region of the Sahel zone, the maximum amount of rainfall occurs in August (see Figure A).
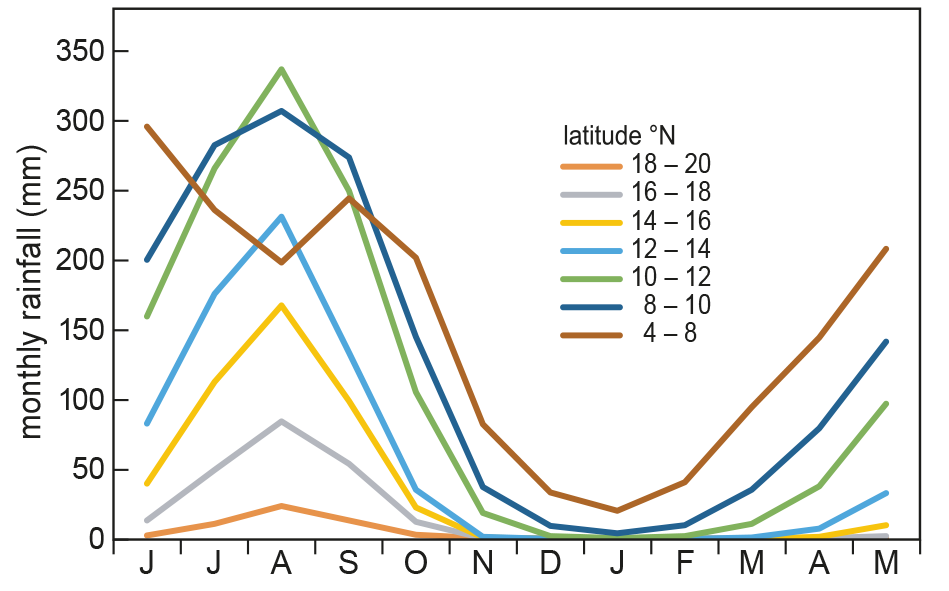
Fig. A. Average monthly rainfall (mm) in northern sub-Saharan Africa between June and May for six latitudinal bands, based on daily measurements between 1920 and 2020 for 161 stations situated between 17.5°W and 37.7°E (source: Zwarts et al. 2023b).
Annual variation
In the Sudan and Sahel zones, the rainy season consists of a few months punctuated by localised downpours and tropical thunderstorms that cause a huge local variation in daily rainfall. As a consequence, even adjacent weather stations can record remarkably different conditions through the entire rainy period. With such large variation, many stations are needed to measure annual rainfall in West Africa.
To form an adequate understanding of the annual variation in rainfall over time, an analysis of rainfall data is made over the course of multiple studies. To be valid, such analyses must incorporate data from a large number of weather stations to take account for the substantial local variation. In a multi-year series of average annual rainfall based on a dataset from different weather stations, missing data at some stations or in some years skews the analyses. This problem is usually resolved by standardising the data across all weather stations. To accomplish this, the average annual rainfall is calculated for each year. These values are compared to the long-term average, and the discrepancy is then usually divided by the standard deviation to yield a value known as the ‘anomaly’, which makes up the rainfall index.
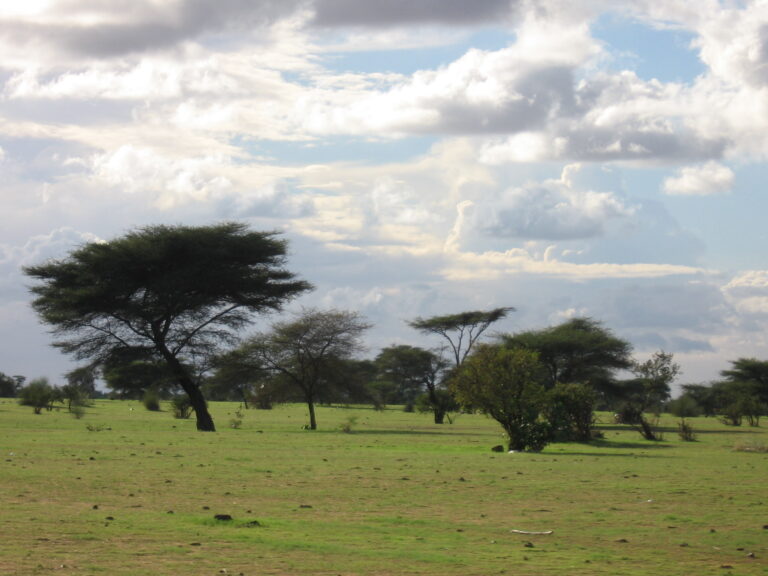
Green savannas in northern Senegal after the first rains. Photograph by Jan van der Kamp, 28 July 2006.
The Sahelian Rainfall Index is presented on this site as annual rainfall anomaly (%). The distinctive pattern of wet and dry years—sometimes with very large differences between consecutive years—is characteristic for the Sahel and Sudan zone, and is most pronounced in the more arid northern regions.
In addition to experiencing extreme transitions from dry to wet, the Sahel and Sudan zones have also suffered a historically unprecedented decline in rainfall since the late 1960s, with distinct periods of long drought. During the 20th century, three periods of drought occurred. The first two, in 1900–15 and 1940–49, were followed by periods of increased rainfall. Thirty years later, in 1973-1976 another drought occurred—but the anticipated recovery in rainfall did not follow. Instead, there was a further decline in rainfall until 1984. This last period is known in the Sahel as the Great Drought—La Grande Sécheresse, whose effects were felt through the period 1972–1993. Since then, rainfall has gradually increased.
Rainfall in the Sahel
Though the number of weather stations is declining, rainfall is still measured on a daily basis across the Sahel. Some of these datasets are made available through NCAR (World Monthly Surface Station Climatology). In recent years, satellites have also been used to estimate and forecast rainfall across the world—for example, the Famine Early Warning System (FEWS) gives satellite-derived rainfall estimates for Africa. These types of data are often used for monitoring past rainfall and forecasting future rainfall.
For an impression of the current rainy season (April–November) we recommend referring to the OPIDIN website, which uses satellite-derived data to calculate the accumulated amount of rainfall in the Upper Niger Basin during the current wet season.
Climate change
The warming climate is a global phenomenon and the northern half of Africa has not escaped this trend. West Africa is currently experiencing rapid climate change (IPCC 2022); this is marked by widespread warming with rising average and extreme temperatures occurring in the Sahel. Compared to global increases, temperatures have been rising faster in the Sahel since 1970 (with a 0.2°C increase per decade in the 1980s and a 0.6°C per decade in the 1990s). This has major implications for water resources and food production in the drought-prone Sahel and Sudan zones.
Climate change projections over the 21th century indicate continued and increasing warming (1.5–6.5 °C). There is substantial uncertainty about future precipitation in West Africa (roughly ranging between −30% and 30%), especially in the Sahel. The IPCC (2022) expects an increase in monsoon precipitation in the central Sahel and, in contrast, a decrease in the western Sahel. In a scenario where there are high levels of greenhouse gases toward the end of the 21st century, these patterns become even more pronounced. Ultimately, the result would be significant increases in both the length of the dry period and the intensity of extreme precipitation events—making the western Sahel one of the world’s most sensitive regions to climate change (see Sylla et al. 2016 and IPCC 2022 for more details).
Sources and more information
CILSS 2016. Les Paysages de l’Afrique de l’Ouest : Une Fenêtre sur un Monde en Pleine Évolution / Landscapes of West Africa. U.S. Geological Survey EROS, 47914 252nd St, Garretson, SD 57030, UNITED STATES. https://eros.usgs.gov/westafrica/sites/default/files/ebook-English/index.html#p=30
Hijmans, R.J., S.E. Cameron, J.L. Parra, P.G. Jones & A. Jarvis, 2005. Very high resolution interpolated climate surfaces for global land areas. International Journal of Climatology 25: 1965-1978.
IPCC 2022. Regional fact sheet – Africa. Sith Assessment Report, Intergovernmental Panel on Climate Change. – download link
Sylla, M.B., Nikiema, P.M., Gibba, P., Kebe, I., Klutse, N.A.B. (2016). Climate Change over West Africa: Recent Trends and Future Projections. In: Yaro, J., Hesselberg, J. (eds) Adaptation to Climate Change and Variability in Rural West Africa. Springer, Cham. https://doi.org/10.1007/978-3-319-31499-0_3 – download link
Zwarts L., Bijlsma R.G., van der Kamp J. & Sikkema, M. 2023a. Distribution and numbers of ground-foraging birds between the hyper-arid Sahara and the hyper-humid Guinea forests. S4 Annual Rainfall (pp 61-65). Ardea 111: 7- 66. download link
Zwarts L., Bijlsma R.G. & van der Kamp J. 2023b. The fortunes of migratory birds from Eurasia: being on a tightrope in the Sahel. S2 Rainfall and flood extent in the Sahel (pp 432-437). Ardea 111: 397-437. download link